Video on Demand (VoD) Network/Compute Optimization Formulation
In Figure 1, we show a number of data centers used to serve clients located in a number of end user regions For concreteness, suppose that the data centers are serving video on demand (VoD) streaming services to client regions.
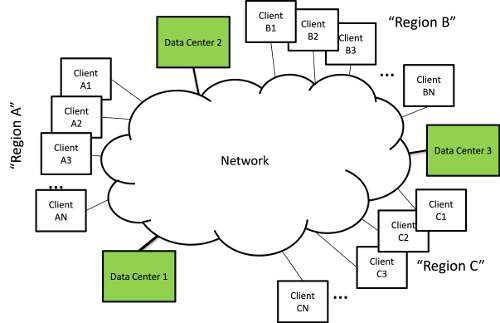
Suppose we had S data centers, $D{C_s}$, and that each can stream a maximum quantity ${Q_s}$ of video. We have R users regions,${U_r}$, that have demands ${D_r}$ for video that must be satisfied.Each $D{C_s}$ has a cost of $c{d_s}$ to stream a unit of video $Q$. In addition, the communication of video from to across the network is subject to network costs and capacity constraints. Let ${q_{sr}}$ be the total bandwidth of video produced at $D{C_s}$ for ${U_r}$.
The objective is to minimize the total cost (data center and network):
$$\sum\limits_s {c{d_s}{q_s}} + \sum\limits_{s,r} {networkCost({q_{sr}})}$$
Subject to the network (link) capacity constraints as well as the data center capacity constraints:
$$\sum\limits_r {{q_{sr}}} \le {Q_s}\quad \forall s $$
And user demands:
$$\sum\limits_s {{q_{sr}}} = {d_r}\quad \forall r $$
To fully specify this network/compute optimization problem we need to include the network costs and constraints from one of our two different multi-commodity flow formulations.
VoD Network/Compute Optimization Example
In Figure 2 we show a simple example network for our VoD optimization. The user regions are denoted by R0-R3, and the data centers by DC0-DC2.

The demands for the user regions, the cost and capacities of the data centers, and the link costs and capacities are embedded in the JSON representation of the network as shown below.
{
  "directed": false,
  "graph": { "name": "VoD Graph", "desc": "Example graph for VoD CSO example" },
  "nodes": [
    { "y": 119, "x": 81, "type": "user_region", "id": "R0", "demand": 10 },
    { "y": 398, "x": 171, "type": "user_region", "id": "R1", "demand": 11 },
    { "y": 80, "x": 552, "type": "user_region", "id": "R2", "demand": 7 },
    { "y": 409, "x": 457, "type": "user_region", "id": "R3", "demand": 9 },
    { "y": 208, "x": 337, "type": "switch", "id": "N4" },
    {
      "cost": 9,
      "capacity": 15,
      "y": 213,
      "x": 174,
      "type": "data_center",
      "id": "DC1"
    },
    { "y": 397, "x": 317, "type": "switch", "id": "N8" },
    { "y": 95, "x": 431, "type": "switch", "id": "N9" },
    {
      "cost": 7,
      "capacity": 15,
      "y": 182,
      "x": 509,
      "type": "data_center",
      "id": "DC0"
    },
    { "y": 135, "x": 246, "type": "switch", "id": "N0" },
    { "y": 235, "x": 61, "type": "switch", "id": "N1" },
    { "y": 315, "x": 74, "type": "switch", "id": "N2" },
    { "y": 304, "x": 309, "type": "switch", "id": "N3" },
    {
      "cost": 5,
      "capacity": 13,
      "y": 341,
      "x": 248,
      "type": "data_center",
      "id": "DC2"
    },
    { "y": 215, "x": 467, "type": "switch", "id": "N5" },
    { "y": 338, "x": 526, "type": "switch", "id": "N6" },
    { "y": 172, "x": 573, "type": "switch", "id": "N7" }
  ],
  "links": [
    {
      "source": "R0",
      "capacity": 12,
      "target": "N0",
      "weight": 137.23296600693843
    },
    {
      "source": "R0",
      "capacity": 10,
      "target": "N1",
      "weight": 91.363832403491
    },
    {
      "source": "R1",
      "capacity": 14,
      "target": "N8",
      "weight": 118.36466261149307
    },
    {
      "source": "R1",
      "capacity": 12,
      "target": "N2",
      "weight": 100.86178327744912
    },
    {
      "source": "R2",
      "capacity": 13,
      "target": "N9",
      "weight": 95.38619301116677
    },
    {
      "source": "R2",
      "capacity": 11,
      "target": "N7",
      "weight": 69.08397108271788
    },
    {
      "source": "R3",
      "capacity": 14,
      "target": "N8",
      "weight": 113.12511871312606
    },
    {
      "source": "R3",
      "capacity": 8,
      "target": "N6",
      "weight": 73.51102796411152
    },
    {
      "source": "N4",
      "capacity": 10,
      "target": "N9",
      "weight": 119.30277477062668
    },
    { "source": "N4", "capacity": 9, "target": "N2", "weight": 250.0 },
    {
      "source": "N4",
      "capacity": 10,
      "target": "N3",
      "weight": 74.46057372261203
    },
    {
      "source": "N4",
      "capacity": 12,
      "target": "N5",
      "weight": 103.27127468480641
    },
    {
      "source": "DC1",
      "capacity": 10,
      "target": "N0",
      "weight": 80.33072048110796
    },
    {
      "source": "DC1",
      "capacity": 14,
      "target": "N1",
      "weight": 88.89218090012317
    },
    {
      "source": "N8",
      "capacity": 9,
      "target": "N2",
      "weight": 223.7829855777915
    },
    {
      "source": "N8",
      "capacity": 9,
      "target": "N3",
      "weight": 68.1077927096489
    },
    {
      "source": "N8",
      "capacity": 13,
      "target": "DC2",
      "weight": 63.8337752809026
    },
    {
      "source": "N8",
      "capacity": 12,
      "target": "N6",
      "weight": 186.2818212072996
    },
    {
      "source": "N9",
      "capacity": 11,
      "target": "N0",
      "weight": 159.66150378763984
    },
    {
      "source": "N9",
      "capacity": 9,
      "target": "N7",
      "weight": 133.1858217406103
    },
    { "source": "DC0", "capacity": 10, "target": "N5", "weight": 30.0 },
    {
      "source": "DC0",
      "capacity": 10,
      "target": "N7",
      "weight": 40.844511935614726
    },
    {
      "source": "N0",
      "capacity": 8,
      "target": "N1",
      "weight": 179.72463319203547
    },
    {
      "source": "N1",
      "capacity": 8,
      "target": "N2",
      "weight": 56.37474091434599
    },
    {
      "source": "N3",
      "capacity": 13,
      "target": "DC2",
      "weight": 47.1124964108405
    },
    {
      "source": "N5",
      "capacity": 13,
      "target": "N6",
      "weight": 109.21711467993539
    },
    {
      "source": "N6",
      "capacity": 11,
      "target": "N7",
      "weight": 143.67628752179616
    }
  ],
  "multigraph": false
}
This JSON network information can be copy and pasted into our ComNetViz App for visualization purposes.
In this example we combined the above formulation with our multi-commodity flow arbitrary paths formulation. This resulted in an optimization problem consisting of 1320 variables and 1774 constraints. The time to solve this on my laptop with an open source solver an no other optimization was 0.819 seconds of which 0.766 seconds were used to load the data (0.053 seconds of number crunching). The optimal pairings between data centers and user regions along with the corresponding "optimal" paths are shown below in JSON form.
{
  "id": "VoD Paths",
  "desc": "Paths for the VoD CSO example",
  "pathList": [
    {
      "load": 10.999999999999986,
      "nodeList": ["DC2", "N8", "R1"],
      "cost": 182.19843789239567,
      "ratio": 0.9999999999999996
    },
    {
      "load": 10.999999999999984,
      "nodeList": ["R1", "N8", "DC2"],
      "cost": 182.19843789239567,
      "ratio": 0.9999999999999992
    },
    {
      "load": 10.000000000000002,
      "nodeList": ["DC1", "N1", "R0"],
      "cost": 180.25601330361417,
      "ratio": 1.0
    },
    {
      "load": 6.999999999999996,
      "nodeList": ["R2", "N7", "DC0"],
      "cost": 109.9284830183326,
      "ratio": 0.9999999999999997
    },
    {
      "load": 6.999999999999985,
      "nodeList": ["R3", "N6", "N5", "DC0"],
      "cost": 212.7281426440469,
      "ratio": 1.0000000000000002
    },
    {
      "load": 2.000000000000004,
      "nodeList": ["R3", "N8", "DC2"],
      "cost": 176.95889399402864,
      "ratio": 0.9999999999999962
    },
    {
      "load": 2.000000000000004,
      "nodeList": ["DC2", "N8", "R3"],
      "cost": 176.95889399402864,
      "ratio": 0.9999999999999971
    },
    {
      "load": 6.999999999999984,
      "nodeList": ["DC0", "N5", "N6", "R3"],
      "cost": 212.7281426440469,
      "ratio": 1.0
    },
    {
      "load": 10.000000000000004,
      "nodeList": ["R0", "N1", "DC1"],
      "cost": 180.25601330361417,
      "ratio": 1.0
    },
    {
      "load": 6.999999999999996,
      "nodeList": ["DC0", "N7", "R2"],
      "cost": 109.9284830183326,
      "ratio": 0.9999999999999998
    }
  ]
}
The JSON for these solution paths can be copy and pasted into our ComNetViz App for visualization purposes.